|
Radschool Association Magazine - Vol 27 Page 16 |
|
Privacy Policy | Editorial Policy | Join the Association | List of Members | Contact us | Index | Print this page |
|
|
|
Global warming!!
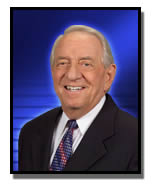
If, like me, you find this global warming business all a bit much to swallow, then you will find this article very interesting indeed. It is presented by TV station KUSI in San Diego in the USA and we feel makes very interesting reading. The story is presented by John Coleman (right).
The Amazing Story Behind the Global Warming Scam.
By John Coleman
The key players are now all in place in Washington and in state governments across America to officially label carbon dioxide as a pollutant and enact laws that tax we citizens for our carbon footprints.
Only two details stand in the way, the faltering economic times and a dramatic turn toward a colder climate. The last two bitter winters have led the public to be sceptical that any runaway global warning exists. There is now an awareness that there may be reason to question whether CO2 really is a pollutant and a significant greenhouse gas.
How did we ever get to this point where bad science is driving big government? And how will we ever stop it?
The story begins with an Oceanographer named Roger Revelle. He served with the Navy in World War II. After the war he became the Director of the Scripps Oceanographic Institute in La Jolla in San Diego, California. Revelle saw the opportunity to obtain major funding from the Navy for doing measurements and research on the ocean around the Pacific Atolls where the US military was conducting atomic bomb tests. He greatly expanded the Institute's areas of interest and among others hired Hans Suess, a noted Chemist from the University of Chicago, who was very interested in the traces of carbon in the environment from the burning of fossil fuels. Revelle tagged on to Suess’ studies and co-authored a paper with him in 1957. The paper raises the possibility that the carbon dioxide might be creating a greenhouse effect and causing atmospheric warming. It seems to be a plea for funding for more studies. Funding, frankly, is where Revelle's mind was most of the time.
Next Revelle hired a Geochemist named David Keeling to devise a way to measure the atmospheric content of Carbon dioxide. In 1960 Keeling published his first paper showing the increase in carbon dioxide in the atmosphere and linking the increase to the burning of fossil fuels.
These two research papers became the bedrock of the science of global warming, even though they offered no proof that carbon dioxide was in fact a greenhouse gas. In addition they failed to explain how this trace gas, only a tiny fraction of the atmosphere, could have any significant impact on temperatures.
Now let me take you back to the 1950s when this was going on. Our cities were entrapped in a pall of pollution from the crude internal combustion engines that powered cars and trucks and from the uncontrolled emissions from power plants and factories. Cars and factories and power plants were filling the air with all sorts of pollutants. There was a valid and serious concern about the health consequences of this pollution and a strong environmental movement was developing to demand action. Government accepted this challenge and new environmental standards were set. Scientists and engineers came to the rescue. New reformulated fuels were developed for cars, as were new high tech, computer controlled engines and catalytic converters. By the mid seventies cars were no longer big time polluters, emitting only some carbon dioxide and water vapour from their tail pipes. Likewise, new fuel processing and smoke stack scrubbers were added to industrial and power plants and their emissions were greatly reduced, as well.
But an environmental movement had been established and its funding and very existence depended on having a continuing crisis issue. So the research papers from Scripps came at just the right moment. And, with them came the birth of an issue; man-made global warming from the carbon dioxide from the burning of fossil fuels.
Revelle and Keeling used this new alarmism to keep their funding growing. Other researchers with environmental motivations and a hunger for funding saw this developing and climbed aboard as well. The research grants began to flow and alarming hypothesis began to show up everywhere.
The Keeling curve showed a steady rise in CO2 in atmosphere during the period since oil and coal were discovered and used by man. As of today, carbon dioxide has increased from 215 to 385 parts per million. But, despite the increases, it is still only a trace gas in the atmosphere. While the increase is real, the percentage of the atmosphere that is CO2 remains tiny, about point four of one percent. (0.41%)
Several hypothesis emerged in the 70s and 80s about how this tiny atmospheric component of CO2 might cause a significant warming. But they remain unproven. Years have passed and the scientists kept reaching out for evidence of the warming and proof of their theories. And, the money and environmental claims kept on building up.
Back in the 1960s, this global warming research came to the attention of a Canadian born United Nation's bureaucrat named Maurice Strong. He was looking for issues he could use to fulfil his dream of one-world government. Strong organized a World Earth Day event in Stockholm, Sweden in 1970. From this he developed a committee of scientists, environmentalists and political operatives from the UN to continue a series of meetings.
Strong developed
the concept that the UN could demand payments from the advanced nations
for the climatic damage from their burning of fossil fuels to benefit the
underdeveloped nations, a sort of CO2 tax that would be the funding for
his one-world government. But, he needed more scientific evidence to
support his primary thesis. So Strong championed the establishment of the
United Nation's Intergovernmental Panel on Climate Change – the UN
IPCC. This was not a pure climate study scientific organization, as we
have been led to believe. It was an organization of one-world government
UN bureaucrats, environmental activists and
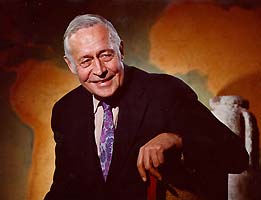
At the same time, that Maurice Strong was busy at the UN, things were getting a bit out of hand for the man who is now called the grandfather of global warming, Roger Revelle (left). He had been very politically active in the late 1950's as he worked to have the University of California locate a San Diego campus adjacent to Scripps Institute in La Jolla. He won that major war, but lost an all important battle afterward when he was passed over in the selection of the first Chancellor of the new campus.
|
|
This guy goes out with his buddies for a night on the town and they cap off the festivities by going to a house of ill repute. A week later, the guy visits his doctor complaining of a large green lump on the end of his penis. The doctor does a thorough exam, then pulls down a weighty medical book and flicks through it till he finds what he's looking for. He looks up and says, "I'm afraid this is serious. We'll have to operate!" "Operate?", exclaims the fellow, "Why, Doc? What's the problem?" "Well, you know how boxers can get a cauliflower ear? You've developed the same sort of thing. You've got a brothel sprout”.
|
|
He left Scripps finally in 1963 and moved to Harvard University to establish a Centre for Population Studies. It was there that Revelle inspired one of his students to become a major global warming activist. This student would say later, "It felt like such a privilege to be able to hear about the readouts from some of those measurements in a group of no more than a dozen undergraduates. Here was this teacher presenting something not years old but fresh out of the lab, with profound implications for our future!" The student described him as "a wonderful, visionary professor" who was "one of the first people in the academic community to sound the alarm on global warming," That student was Al Gore. He thought of Dr. Revelle as his mentor and referred to him frequently, relaying his experiences as a student in his book Earth in the Balance, published in 1992.
So there it is, Roger Revelle was indeed the grandfather of global warming. His work had laid the foundation for the UN IPCC, provided the anti-fossil fuel ammunition to the environmental movement and sent Al Gore on his road to his books, his move, his Nobel Peace Prize and a hundred million dollars from the carbon credits business.
What happened next is amazing. The global warming frenzy was becoming the cause celeb of the media. After all the media is mostly liberal, loves Al Gore, loves to warn us of impending disasters and tell us "the sky is falling, the sky is falling". The politicians and the environmentalist loved it, too.
But the tide was
turning with Roger Revelle. He was forced out at Harvard at 65 and
returned to California and
And in 1991 Revelle teamed up with Chauncey Starr, founding director of the Electric Power Research Institute and Fred Singer, the first director of the U.S. Weather Satellite Service, to write an article for Cosmos magazine. They urged more research and begged scientists and governments not to move too fast to curb greenhouse CO2 emissions because the true impact of carbon dioxide was not at all certain and curbing the use of fossil fuels could have a huge negative impact on the economy and jobs and our standard of living. I have discussed this collaboration with Dr. Singer. He assures me that Revelle was considerably more certain than he was at the time that carbon dioxide was not a problem.
Roger Revelle died of a heart attack three months after the Cosmos story was printed. Oh, how I wish he were still alive today. He might be able to stop this scientific silliness and end the global warming scam.
Al Gore has dismissed Roger Revelle's Mea Culpa as the actions of a senile old man. And, the next year, while running for Vice President, he said the science behind global warming is settled and there will be no more debate, From 1992 until today, he and his cohorts have refused to debate global warming and when they are asked about it by we sceptics, they insult us and call us names.
|
|
The difference between a duck and a co-pilot? The duck can fly.
|
|
So today we have the acceptance of carbon dioxide as the culprit of global warming. It is concluded that when we burn fossil fuels we are leaving a dastardly carbon footprint which we must pay Al Gore or the environmentalists to offset. Our governments on all levels are considering taxing the use of fossil fuels. The Federal Environmental Protection Agency is on the verge of naming CO2 as a pollutant and strictly regulating its use to protect our climate. The new President and the US congress are on board. Many state governments are moving on the same course.
We are already suffering from this CO2 silliness in many ways. Our energy policy has been strictly hobbled by no drilling and no new refineries for decades. We pay for the shortage this has created every time we buy gas. On top of that the whole thing about corn based ethanol costs us millions of tax dollars in subsidies. That also has driven up food prices. And, it’s not over yet!!!
And, I am totally convinced there is no scientific basis for any of it.
Global Warming!! It is the hoax!! It is bad science!! It is a high-jacking of public policy!! It is no joke!!
It is the greatest scam in history.
If you would like to read more about this amazing scam, check out these links.
Global warming scare debunked.
Things are normal in Greenland.
Are about to enter an Ice Age??
If it’s Global Warming, why is it so cold??
Scientists debunk Global Warming claim.
The UN IPCC scientists debunked by their peers.
|
|
Please don't tell Mum I'm a pilot, she thinks I play piano in a whorehouse.
|
|
|
|
BALANCE
In the interests of balance, we have included this article about ocean temperatures and sea levels. The non-global warming team point to the ocean temps, which aren’t rising, as positive evidence that the earth is not warming. This whole climate thing is, understandably, a very complex problem. People for and against global warming tend to grab snippets from various studies to support their politics. The previous Bush administration tended to support funding for science and publications which supported their politics. This article is clear, unbiased, and provides a good example of how one set of data does not answer all the questions in a complex system such as planetary climate or an MMRPG.
After you’ve read both articles – make your own mind up………because, it seems no-one really knows what’s happening….
Correcting Ocean Cooling.
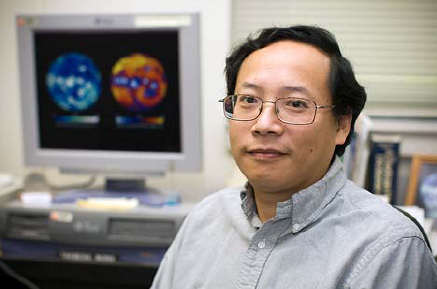
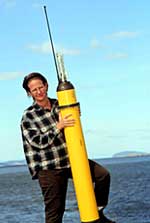
On a Thursday evening in February 2007, Josh Willis stood in front of his laptop, his wife cajoling him to get ready to go out to dinner. He looked with a sinking feeling at the map he had just made. Willis, a scientist at NASA’s Jet Propulsion Laboratory, specializes in making estimates of how much heat the ocean stores from year to year.
Josh Willis is an oceano-grapher at NASA’s Jet Propulsion Laboratory who specializes in sea level trends and the response of the oceans to global warming.
“The oceans are absorbing more than 80 percent of the heat from global warming,” he says. “If you aren’t measuring heat content in the upper ocean, you aren’t measuring global warming.”
In 2004, Willis published a time series of ocean heat content showing that the temperature of the upper layers of ocean increased between 1993-2003. In 2006, he co-piloted a follow-up study led by John Lyman at Pacific Marine Environmental Laboratory in Seattle that updated the time series for 2003-2005. Surprisingly this showed a large decrease in heat content—about 5 times as large as the previous decade’s warming. Surprisingly, the ocean seemed to have cooled.
Not surprisingly, says Willis wryly, that paper got a lot of attention, not all of it the kind a scientist would appreciate. In speaking to reporters and the public, Willis described the results as a “speed bump” on the way to global warming, evidence that even as the climate warmed due to greenhouse gases, it would still have variation. The message didn’t get through to everyone, though. On blogs and radio talk shows, global warming deniers cited the results as proof that global warming wasn’t real and that climate scientists didn’t know what they were talking about.
That February evening, Willis says, he was updating maps and graphs with the data that had become available since the 2006 ocean cooling paper was published. He was preparing for a talk he had been invited to give at the National Centre for Atmospheric Research in Boulder, Colorado. The topic was “Ocean cooling and its implications for understanding recent sea level trends.”
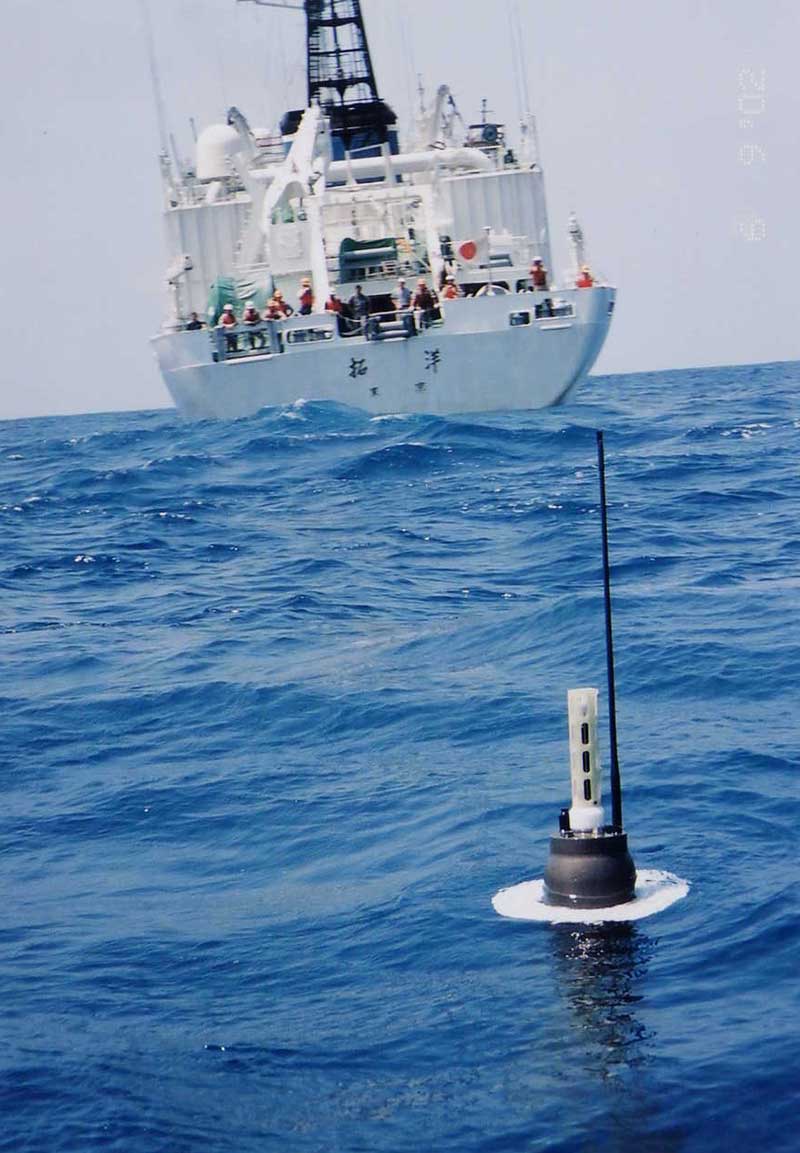
He was looking at a map of global ocean temperatures measured by a flotilla of autonomous, underwater robots that patrol the world’s oceans. The devices, Argo floats, sink to depths of up to 2,000 meters, drift with the currents, and then bob up to the surface, taking the temperature of the water as they ascend. When they reach the surface, they transmit observations to a satellite. According to the float data on his computer screen, almost the entire Atlantic Ocean had gone cold. Unless you believe The Day After Tomorrow, Willis jokes, impossibly cold.
Argo floats are aquatic robots that measure ocean temperature, pressure, and salinity at depths of up to 2,000 meters. The floats augment satellite, ship, and buoy measurements of the ocean.
“Oh, no,” he remembers saying. “What’s wrong?” his wife asked. “I think ocean cooling isn’t real.”
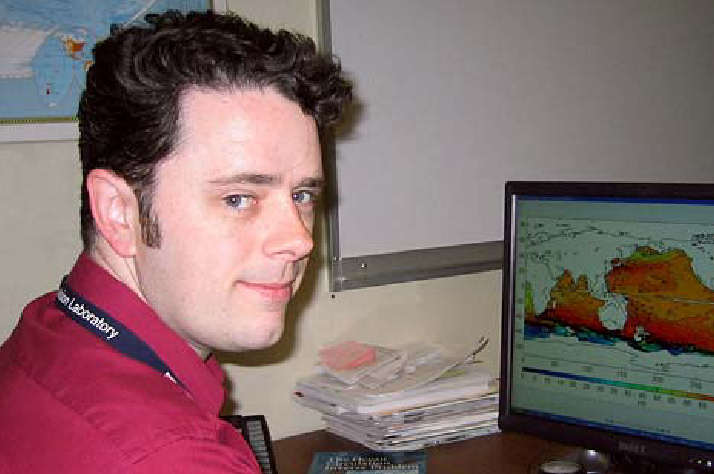
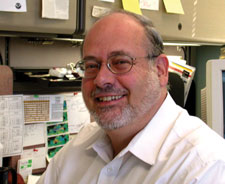
On the opposite side of the country, Takmeng Wong and his colleagues at NASA’s Langley Research Center in Virginia had come to the same conclusion. Since the 1980s, Wong has studied the most fundamental climate variable of all: the net flux of energy at the top of the Earth’s atmosphere—how much solar energy is coming in minus how much the Earth reflects and radiates as heat.
Takmeng Wong
(below) uses satellites to measure the exchange of energy between the
Earth and space. “Our team has been involved for many years in
constructing a time series of net flux from satellite data, going back to
the 1980s,” says Wong. The observations started with a satellite mission
called the Earth Radiation Budget
Net flux is the difference between the energy absorbed by the Earth and the energy the Earth reflects or releases as heat. If net flux is positive, more energy is coming in than is going out and the earth heat us, if it’s negative, the earth cools - simple. Most of the excess energy is stored by the oceans.
Wong and his team-mates’ record of net flux measured by NASA satellites shows that between the mid-1980s and the end of the 1990s, the amount of incoming and outgoing energy at the top of the atmosphere crept out of balance. By the end of the period, about 1.4 watts per square meter more energy was entering the Earth system than leaving it. Stitching the observations from multiple sensors into a coherent long-term record is complicated. Scientists are always looking for ways to check the accuracy of these pieced-together climate records. Since the ocean is the planet’s single biggest reservoir for surplus energy, the energy imbalance Wong and his colleagues detected in net flux observations ought to be detectable in ocean heat content, too. The connection between these two related, but independently measured vital signs of Earth’s climate brought Wong and Willis into collaboration in 2006.
“When Josh Willis published his first global estimates of ocean heat storage, we saw it as a chance to verify the accuracy of our energy balance time series against a completely independent set of measurements. Josh gave us data on ocean heat storage through 2002, and we compared it to our net flux estimates. There was good agreement, and so we published a paper on that together.” “We continued to update our net flux time series each year, and we concluded that the positive energy imbalance that we detected previously remained the same,” says Wong. So he was surprised, even a little alarmed, when Lyman and Willis’ reached the opposite conclusion in 2006, saying that the ocean had cooled.
From 1993 to 2003, measurements of heat storage in the oceans agreed with satellite observations of net flux. After 2003, however, surface observations suggested that the ocean was losing heat, while satellite measurements of net flux showed the Earth was still slowly gaining energy. This mismatch was a hint that there might be a problem with one of the data sets.
Maybe Melt Water Explains It.
Willis admits
the results were puzzling, but the apparent contradiction didn’t
automatically convince him the ocean heat data was wrong. A large pulse of
melt water from glaciers and ice sheets might account for a rise in sea
level even as the ocean cooled and contracted. The possibility that ice
melting during the period had been large enough to offset a sea level drop
became more remote later in 2006, with the release of several studies
based on data from NASA’s Gravity Recovery and Climate Experiment, or
GRACE, mission. Launched in
When scientists began analysing the first few years of GRACE data, they concluded that Greenland and West Antarctica were definitely melting and contributing to a rise in sea level. But, says Wong, “The amount did not seem to be enough to offset a cooling as large as they had reported.” “We let Josh know, diplomatically of course, that all signs were pointing toward his data,” says Wong.
“I was aware that they were not seeing this huge cooling that we were seeing in the ocean,” says Willis. “In fact, every body was telling me I was wrong. And there were always doubts,” says Willis. “After all, it was a very surprising result. As a scientist, its part of my job to turn over every leaf. So I was constantly going back over the data and looking for problems.” For nearly a year after the 2006 ocean cooling paper was published, nothing obvious turned up. It wasn’t until that next year of data came in that the cooling in the Atlantic became so large and so widespread that Willis accepted the cooling trend for what is was: an unambiguous sign that something in the observations was “clearly not right.”
|
|
The edges of the air can be recognised by the appearance of ground, buildings, sea, trees and interstellar space. It is much more difficult to fly there.
|
|
When scientists mistrust their data, they do they same thing you do when you think your watch is off: they check another clock. To diagnose the problem in the Atlantic, Willis needed to compare ocean temperature measurements from multiple sources. The first source he turned to was sea level data from satellite altimeters. Because water expands when it absorbs heat, and contracts when it cools, sea level is physically connected to heat content in the upper ocean. Satellite altimeters measure sea surface height with radar. The radar sends a pulse of energy toward the Earth’s surface and listens for the echo. The time delay and intensity of the echo reveal the altitude of the sea surface.
Willis also had
ocean-based data sets, including temperature profiles from the Argo robot
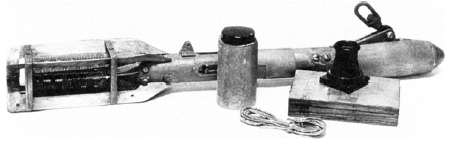
fleet as well as from expendable bathythermographs, called “XBTs” for
short. XBTs are the equivalent of a disposable razor. A temperature sensor
is spooled out behind a ship by thin copper wire. It sinks through the
water at a constant rate, making measurements at increasing depths,
transmitting them back to the ship via the wire until the entire length of
wire is unspooled (up to 1
An XBT may look like a rocket, but it’s more like a fishing weight: a heavy zinc nose houses a thermistor (to measure temperature). They have been used by the U.S. Navy and oceanographers since the 1960s. “Basically, I used the sea level data as a bridge to the in situ [ocean-based] data,” explains Willis, comparing them to one another figuring out where they didn’t agree. “First, I identified some new Argo floats that were giving bad data; they were too cool compared to other sources of data during the time period. It wasn’t a large number of floats, but the data was bad enough, so that when I tossed them, most of the cooling went away. But there was still a little bit, so I kept digging and digging.”
The digging led him to the data from the expendable temperature sensors, the XBTs. A month before, Willis had seen a paper that showed a comparison of XBT data collected over the past few decades to temperatures obtained in the same ocean areas by more accurate techniques, such as bottled water samples collected during research cruises. Compared to more accurate observations, the XBTs were too warm. The problem was more pronounced at some points in time than others.
When he factored the too-warm XBT measurements into his ocean warming time series, the last of the ocean cooling went away. Later, Willis teamed up with Susan Wijffels (right) of the CSIRO and other ocean scientists to diagnose the XBT problems in detail and come up with a way to correct them. “So the new Argo data were too cold, and the older XBT data were too warm, and together, they made it seem like the ocean had cooled,” says Willis. The February evening he discovered the mistake, he says, is “burned into my memory.” He was supposed to fly to Colorado that weekend to give a talk on “ocean cooling” to prominent climate researchers. Instead, he’d be talking about how it was all a mistake.
Smoothing the Bumps.A scientist could hardly be expected to be happy about finding a mistake in his work after he had published it. But if you have to watch your research go down in flames, it may help to regard it as an offering on the sacrificial fire of scientific progress. In the case of “ocean cooling,” Willis has plenty of reasons to consider the sacrifice was worth it.
The first
payoff for finding and fixing the XBT errors was that it allowed
scientists to reconcile a stubborn and puzzling mismatch between climate
model simulations of ocean warming for the past half century and
observations. The second was that it helped explain why sea level rise
between 1961-2003 was larger than scientists had previously been able to
account for.
Much of what scientists know about how ocean heat content has changed over the past half century comes from the work of Sydney Levitus, (right) the director of NOAA’s Ocean Climate Laboratory in Silver Spring, Maryland, and his colleagues. In the early 1990s, the United Nations Education and Scientific Organization (UNESCO) asked Levitus to undertake a scientific rescue mission. The group wanted Levitus to locate historical ocean data sitting around in dusty library stacks, mouldy basements, and forgotten filing cabinets around the world before they were lost to natural disaster or neglect. The project became known as the Global Oceanographic Data Archeology and Rescue Project (GODAR).
Historical
climate records provide important context for modern measurements. This
type of XBT was used in the mid-1960s. “Since 1993 or so, we have added
several million historical temperature profiles. This collection allowed
us for the first time to estimate the change in ocean heat content from
1955 on. When we first published these results in 2000, they received a
great deal of media, congressional, and scientific attention,
In mid-2008, however, a team of scientists led by Catia Domingues (right) and John Church from the CSIRO, and Peter Gleckler, from Lawrence Livermore National Laboratory in California, revised long-term estimates of ocean warming based on the corrected XBT data. Since the revision, says Willis, the bumps in the graph have largely disappeared, which means the observations and the models are in much better agreement. “That makes everyone happier,” Willis says.
“What is now evident is that it may be possible for the ocean to gain heat and lose it more rapidly than we had thought possible. There may be other phenomena [similar to El Niño] operating on different time scales that can explain interdecadal increases and decreases,” says Levitus. Even if these ups and downs don’t change the long-term destination of global warming, they could reveal more detail about what kind of ride we can expect.
For CSIRO scientist Catia Domingues and her colleagues, being able to show that climate simulations and observations were in better agreement than they previously seemed was only the first payoff of the corrections to the XBT data. The second was that they used the revised data to balance the sea level budget for 1961-2003.
The two main causes of sea level rise are melting of the Earth’s frozen landscapes, ice sheets, ice caps, and glaciers and thermal expansion. Water expands when it absorbs heat. If you add the amount of thermal expansion to the amount of melting, it should equal the observed sea level rise, but somehow, it never did. “When scientists added these terms, the sum was always less than the observed sea level rise measured by tide gauges and satellite altimeters. It’s like one plus one did not equal two,” says Domingues. Rising sea level is one of the most serious consequences of global warming. In the past 50 years, the sea level has risen about 1.8 (plus or minus 0.3) millimeters a year. Satellite observations since 1993 indicate the pace has accelerated to about 3 millimeters per year. What’s driving the acceleration? How much and how fast will sea level rise in the future?
In principle, it should be possible to add up each of the individual components of sea level rise, melting continental ice sheets in Antarctica and Greenland, retreating glaciers, the thermal expansion of near-surface water, thermal expansion of the deep ocean, and changes in water storage on land, to calculate the total rise over time. Unfortunately, early attempts to balance the sea level budget never added up.
Susan Wijffels and her colleagues from the CSIRO, along with Josh Willis, provided a way to correct the XBT data, and the corrections were made and the first revised estimates of sea level rise due to ocean warming for the period 1961 to 2003 were finished. What was found was that ocean heating was larger than scientists previously thought, and so the contribution of thermal expansion to sea level rise was actually 50 percent larger than previous estimates.
It seems that the main reason the sea level budget between 1961 and 2003 would not add up before is that scientists were underestimating just how much warming and expanding the ocean was experiencing. But what about more recent changes in sea level?
“In this analysis, we focused on 1961-2003 because it is the time period highlighted as being an important, unresolved issue in the last IPCC report [Intergovernmental Panel on Climate Change Fourth Assessment Report],” said Domingues, “but also because the problems with the newest Argo data—the problems that Josh Willis found as well as other problems we have identified—haven’t been totally solved. For the most recent years [2003-2007], the sea level budget once again does not close. Our team is still working on that problem.”
The corrected XBT data resolved much of the discrepancy between calculated and observed sea level rise by increasing the amount of change contributed by thermal expansion. Now, the combined effects of melting ice, thermal expansion, and terrestrial storage match measurements from tide gauges and satellite more closely, at least until the late 1990s.
They are also exploring how volcanic eruptions influence ocean heating, and whether a better understanding of how volcanoes influence the energy balance of the ocean will help explain short-term variability in ocean warming and cooling.
“One thing we found was that climate models that do not include volcanic forcing tend to overestimate the long-term change, and their simulated decadal variability is not in agreement with the observations. On the other hand, the models that include volcanic forcing are more realistic in terms of decadal variability, but they tend to slightly underestimate the long-term warming,” she says. “This kind of result tells us volcanic forcing is important, but that we don’t totally understand it yet.”
If there is a moral to this story, it’s that when it comes to understanding the climate system, it’s hard to imagine too much redundancy. Every scientist involved in these studies says the same thing: to understand and predict our climate and how it is going to change, we need it all. We need multiple, independent, overlapping sets of observations of climate processes from space and from the Earth’s surface so that we can create long-term climate records—and have confidence that they are accurate. We need theories about how the parts of the Earth system are related to each other so that we can make sense of observations. And we need models to help us see into the future.
“Models are not perfect,” says Syd Levitus. “Data are not perfect. Theory isn’t perfect. We shouldn’t expect them to be. It’s the combination of models, data, and theory that lead to improvements in our science, in our understanding of phenomena.”
|
|
A copilot is a dill until he spots opposite direction traffic at 12 o'clock, after which he's a bloody idiot for not seeing it sooner. |
|
|
|
Back Go to page: 1 2 3 4 5 6 7 8 9 10 11 12 13 14 15 16 17 18 19 Forward |

 a semi retirement position at UCSD. There he had time to rethink Carbon
Dioxide and the greenhouse effect. The man who had inspired Al Gore and
given the UN the basic research it needed to launch its Intergovernmental
Panel on Climate Change was having second thoughts. In 1988 he wrote two
cautionary letters to members of Congress. He wrote, "My own personal
belief is that we should wait another 10 or 20 years to really be
convinced that the greenhouse effect is going to be important for human
beings, in both positive and negative ways." He added, "…we should be
careful not to arouse too much alarm until the rate and amount of warming
becomes clearer."
a semi retirement position at UCSD. There he had time to rethink Carbon
Dioxide and the greenhouse effect. The man who had inspired Al Gore and
given the UN the basic research it needed to launch its Intergovernmental
Panel on Climate Change was having second thoughts. In 1988 he wrote two
cautionary letters to members of Congress. He wrote, "My own personal
belief is that we should wait another 10 or 20 years to really be
convinced that the greenhouse effect is going to be important for human
beings, in both positive and negative ways." He added, "…we should be
careful not to arouse too much alarm until the rate and amount of warming
becomes clearer." Did
Roger Revelle attend the Summer enclave at the
Did
Roger Revelle attend the Summer enclave at the
 Experiment and today are being made with Clouds and the Earth’s Radiant
Energy System (CERES) sensors on NASA’s Terra and Aqua satellites.
Experiment and today are being made with Clouds and the Earth’s Radiant
Energy System (CERES) sensors on NASA’s Terra and Aqua satellites.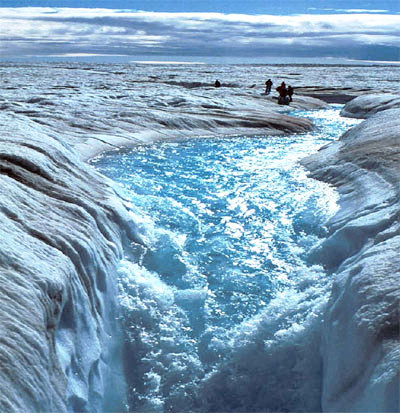

 because the warming that we saw was consistent with what would have been
expected due to the increased greenhouse gases in the atmosphere,” recalls
Levitus. What wasn’t consistent were several large bumps in the graph of
heat content over time. “We saw an overall linear [warming] trend that was
consistent” says Levitus, “but we also saw some very large interdecadal
variability. In particular, toward the late 1970s, heat content increased
substantially and then around 1980, it decreased substantially.” “Those
bumps gave everyone heartburn,” says Willis. There was no established
physical explanation for them, and climate models didn’t reproduce them.
The science community wasn’t sure whether the discrepancy cast doubt on
the models or the observations, but fingers got pointed in both
directions.
because the warming that we saw was consistent with what would have been
expected due to the increased greenhouse gases in the atmosphere,” recalls
Levitus. What wasn’t consistent were several large bumps in the graph of
heat content over time. “We saw an overall linear [warming] trend that was
consistent” says Levitus, “but we also saw some very large interdecadal
variability. In particular, toward the late 1970s, heat content increased
substantially and then around 1980, it decreased substantially.” “Those
bumps gave everyone heartburn,” says Willis. There was no established
physical explanation for them, and climate models didn’t reproduce them.
The science community wasn’t sure whether the discrepancy cast doubt on
the models or the observations, but fingers got pointed in both
directions.